
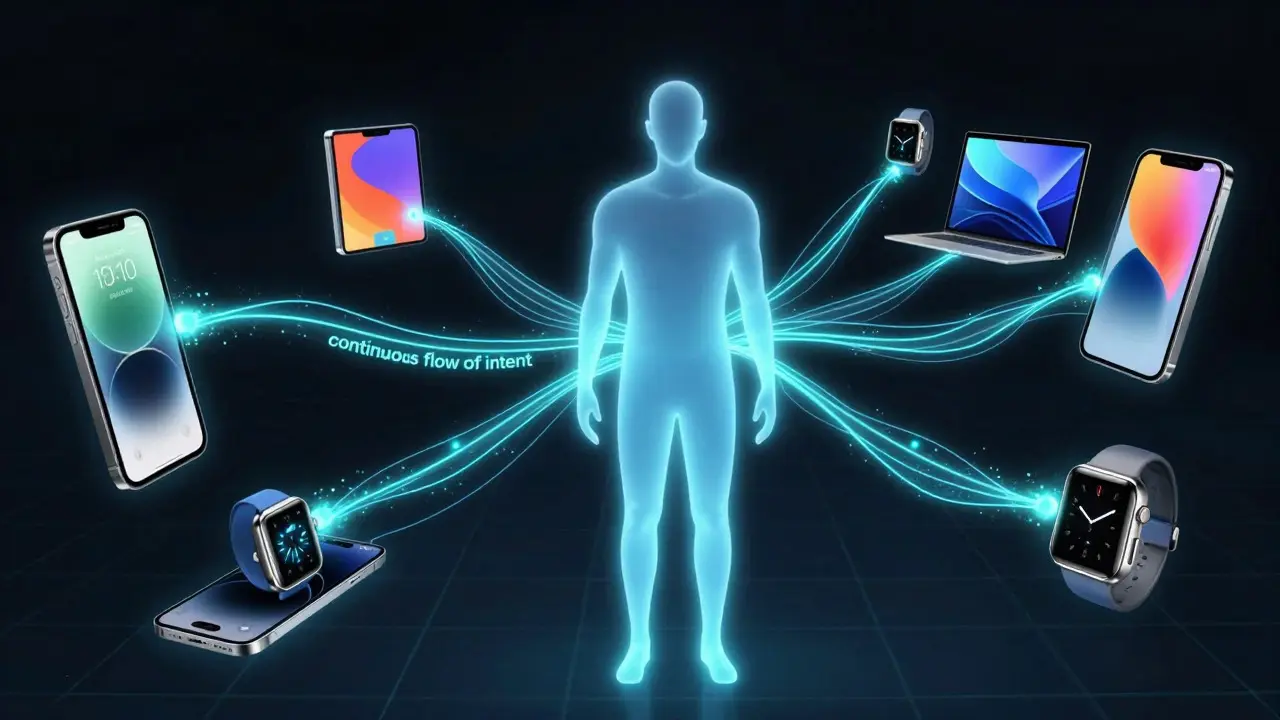
Most teams still treat the iPhone and the Mac as separate products. They build dashboards that track bounces on iOS and conversions on desktop, missing the fact that a single human being is moving between both in real-time. If you are designing for Apple a technology company whose hardware and software integration creates a seamless user experience across multiple devices, this siloed view costs you insights. You aren't just measuring app usage; you are measuring a continuous flow of intent that spans screens.
The core problem with traditional web analytics is identity fragmentation. A user starts a search on their iPad, switches to their MacBook Pro to read an article, and finishes checkout on their iPhone. Without a unified view, your data shows three distinct sessions with no connection. This article breaks down how to measure these cross-device flows effectively, focusing on the specific constraints and opportunities within the Apple ecosystem.
Why Standard Analytics Fail in Ecosystems
Standard cookie-based tracking assumes a one-to-one relationship between a browser and a person. In an ecosystem like Apple's, that assumption collapses. Users often have multiple active sessions simultaneously. Think about it: you might be listening to music on your AirPods while coding on your Mac and checking notifications on your Watch. These aren't three users; they are one context.
The challenge lies in the Universal Identifier a unique code assigned to each device or user account used to track behavior across platforms. While IDFA the Identifier for Advertisers, a UUID used by Apple for mobile advertising attribution helps with ad attribution, it doesn't solve product experience mapping. For UX purposes, you need to look at account-level signals rather than device-level cookies. The goal is to stitch together the timeline of a user's interaction with your service across all their connected devices.
Defining the Cross-Device Journey
To measure what matters, you first need to define what a "journey" looks like in this context. It isn't linear. It is often concurrent. Consider a typical workflow for a creative professional using Final Cut Pro. They might sketch ideas on an iPad, refine them on a Mac, and preview the final render on an Apple TV. Each touchpoint serves a different purpose in the production pipeline.
When mapping these flows, focus on three key dimensions:
- Initiation Point: Where does the intent start? Is it a push notification on the iPhone or a search query on the Mac?
- Transition Trigger: What causes the switch? Is it a screen size limitation, a feature gap, or simply habit?
- Completion State: On which device is the task finally resolved?
This framework helps you identify friction points. If most users initiate on mobile but complete on desktop, your mobile interface might be too limited for the final step. Conversely, if they start on desktop and abandon on mobile, your mobile version might lack critical features.
Technical Strategies for Unified Tracking
How do you actually capture this data without invading privacy? The answer lies in leveraging the existing infrastructure of the operating system. Since iOS 14 and macOS Big Sur, Apple has tightened third-party tracking, making server-side events and account linkage more important than client-side scripts.
Here is a practical approach to implementing unified tracking:
- Use Account-Based Identity: Link all devices to a single user account. When a user logs in on any device, update their profile with the device type and OS version. This creates a reliable anchor point.
- Implement Server-Side Events: Instead of relying solely on JavaScript pixels, send key actions (like 'add_to_cart' or 'video_play') directly from your backend. This ensures consistency regardless of the client environment.
- Leverage Handoff Signals: Monitor when a user uses native handoff features (like copying text on iPhone and pasting on Mac). While not always explicitly logged, high correlation between copy/paste events and subsequent actions can indicate a transition.
For developers working with Swift, integrating the AppTrackingTransparency an API framework introduced by Apple to manage user consent for app tracking framework is crucial. It allows you to request permission to link data across apps, providing a legal and technical pathway to richer data sets.
Key Metrics for Ecosystem Health
Once the data plumbing is in place, which metrics should you watch? Forget vanity metrics like total page views. They don't tell you anything about the ecosystem's cohesion. Instead, focus on these four indicators:
| Metric Type | Single-Device Focus | Cross-Device Focus | Why It Matters |
|---|---|---|---|
| Engagement | Average Session Duration | Multi-Session Depth | Shows how many devices a user actively uses during a task cycle. |
| Conversion | Bounce Rate | Journey Completion Rate | Measures success regardless of where the user ends up. |
| Retention | Daily Active Users (DAU) | Ecosystem Retention | Tracks users who remain active on at least two devices per week. |
| Friction | Error Rate per Device | Transition Drop-off | Identifies where users get stuck when switching contexts. |
The Journey Completion Rate a metric measuring the percentage of users who finish a defined process across any combination of devices is particularly powerful. If a user starts a purchase on an iPad and finishes on a Mac, that is a successful conversion for your business, even if the iPad session ended in a "bounce" according to old metrics.
Design Implications for UX Teams
Data without action is just noise. How does this analytics shift change your design process? It forces you to think in terms of continuity rather than completeness. Your mobile app doesn't need to replicate every feature of your desktop app. It needs to handle the initiation and monitoring phases well, leaving the heavy lifting to the larger screen.
Consider the concept of Contextual Continuity the design principle ensuring that user state and progress are preserved seamlessly across different devices. If a user pauses a video on their laptop, resuming it on their phone should happen instantly. Analytics can reveal if this transition is smooth or if there is a lag that causes frustration. High drop-off rates during transitions often point to synchronization issues or UI inconsistencies.
Furthermore, understanding the primary entry point helps prioritize development resources. If 70% of journeys start on the iPhone, your mobile onboarding must be flawless. If 80% end on the Mac, your desktop export features must be robust. Balancing these priorities based on actual flow data prevents over-engineering one platform at the expense of the other.

Common Pitfalls to Avoid
Even with the right tools, teams make mistakes that skew their data. Here are the most common traps:
- Over-reliance on Cookies: Cookies expire, get blocked, or reset. In an ecosystem, they are unreliable anchors. Always prefer account-based identification.
- Ignoring Time Zones: Users travel. A "session" might span time zones. Ensure your timestamp handling accounts for local time versus UTC to avoid breaking journey sequences.
- Assuming Linear Paths: Don't force data into a funnel model. Use sequence analysis to see the actual order of events, which is often non-linear.
- Neglecting Offline States: Users use devices offline. Sync events when they reconnect. Failure to log these syncs creates gaps in the journey map.
By avoiding these pitfalls, you ensure that your analytics reflect reality, not just the limitations of your tracking setup.
Future-Proofing Your Measurement Strategy
Technology evolves, and so do user behaviors. As augmented reality glasses become more mainstream, the definition of "cross-device" will expand further. Your measurement strategy needs to be modular. Build your data pipelines to accept new device types without requiring a full rewrite. Use standardized event schemas so that adding a new sensor or form factor doesn't break your historical comparisons.
Ultimately, the goal of ecosystem analytics isn't just to collect more data. It's to understand the human behind the hardware. By measuring flows instead of isolated sessions, you gain the ability to design experiences that feel invisible, intuitive, and truly connected. That is the essence of great ecosystem design.
What is the difference between cross-device tracking and multi-device analytics?
Cross-device tracking focuses on linking individual user identities across different hardware to reconstruct a single journey. Multi-device analytics often refers to aggregating data from multiple devices to understand broader trends without necessarily linking specific individuals. The former is user-centric; the latter is population-centric.
How does Apple's privacy policy affect ecosystem analytics?
Apple's strict privacy policies limit third-party cookie usage and require explicit consent for app tracking via IDFA. This pushes teams toward first-party data collection methods, such as account-based login and server-side event logging, which are more reliable for long-term ecosystem analysis.
Which device should be considered the primary device in analytics?
There is no single primary device. Instead, define the 'anchor device' as the one where the user holds the highest-value account or spends the most time. However, for journey analysis, the focus should be on the sequence of interactions rather than assigning a hierarchy to devices.
Can I measure cross-device flows without user login?
It is difficult but possible using probabilistic matching techniques, such as IP address clustering and device fingerprinting. However, accuracy drops significantly compared to account-based tracking. For high-stakes decisions, login-based data is recommended.
What tools are best for visualizing cross-device journeys?
Standard BI tools like Tableau or Power BI can work if configured correctly. Specialized customer journey mapping tools offer better visualization of non-linear paths. The key is choosing a tool that supports sequence analysis and can handle large volumes of timestamped events.